LA Story - successful learning analytics means understanding the data
Ethan Henry and Mimi Weiss share their lessons learned from implementing learning analytics at City University of London.

Adapting to the times
City University of London (City) has around 20,000 students of whom over 60% are undergraduates and over 30% come from outside the UK. A high proportion of students are the first in their family to attend university and a high proportion work during their course of study.
Our learning analytics project took off around the time of the Covid-19 pandemic. We had been working on a proof of concept for learning analytics with a plan to use data to offer tailored interventions and support to students at risk of not progressing. We had just introduced a new ‘swipe card’ attendance system when the pandemic hit, so the overnight switch from in-person to online teaching resulted in a gap in attendance data.
We took the opportunity to use the virtual learning environment (VLE) engagement data we had integrated with Jisc’s learning analytics system to mitigate against the lack attendance data.
Understanding priorities
Our initial focus for learning analytics was to support students at risk of non-progression, which we hypothesised would in turn improve retention. While that focus remains relevant, we are also looking at using analytics to support student wellbeing.
Using data in this way raises important ethical questions so we developed principles and a code of practice for learning analytics. This was supported by Jisc’s code of practice for learning analytics and data maturity framework which provide invaluable advice on the constraints and ethics of the information lifecycle.
We discovered that learning analytics is a starting point for conversations with students about their learning. We found it most helpful to conceive it as a non-punitive practice that supports student success.
People and processes
Each of our 6 schools has a dedicated engagement officer who can support up to 5000 students. We recognised that differences between and within the schools meant that a ‘one size fits all’ approach would not be appropriate.
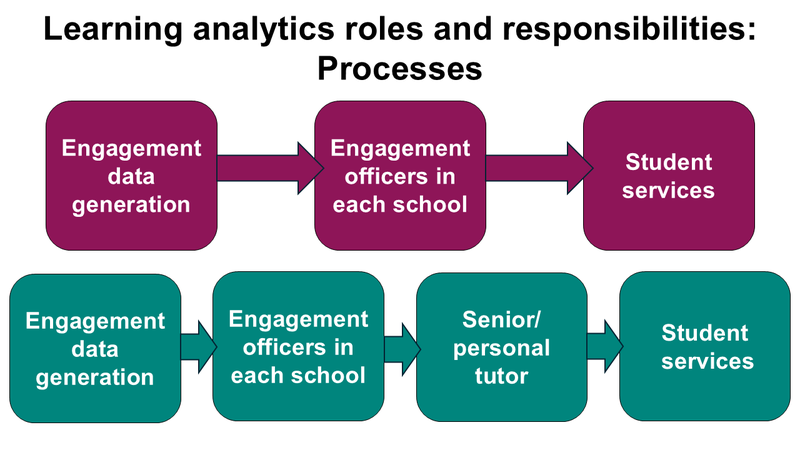
Students are contacted in different ways but we have a set of standard process which clearly define roles and responsibilities:

Each school receives a weekly engagement report in a standard format with a process for contacting students that is tailored for each school. For example, some schools may triage the students with direct conversations while others may refer the student to their personal tutor.
Our approach to learning analytics makes it clear that decisions should not be made on the data alone and our engagement officers work closely with personal tutors and student services.
Setting parameters
Ethan’s full-time learning analytics role allowed him to interrogate and adjust the engagement metrics that informed the reports. The dedicated time allowed us to develop transparent engagement reporting that was easy to communicate.
We started by identifying the data that engagement officers needed to help them identify students at risk of disengagement. For us, these included:
- VLE data (including Jisc’s learning analytics system)
- Attendance data (swipe card system)
- Grades (Jisc’s learning analytics system)
We started by using the metrics generated by Jisc’s learning analytics system which compare students’ engagement to their module cohort.
The modular comparison was key for us. We found that comparing students on different courses didn’t work well for us due to discrepancies in how learning and teaching systems are used across courses.
Communicating the data
Understanding the data is key. We needed to be able to easily explain what the data is telling us and why the data is important to achieving our aims.
Setting the engagement parameters and understand the data that informed them helped us explain why a student had been highlighted as ‘at risk of disengagement’.
We found that if we couldn’t explain how we came to our calculations to deans and personal tutors we would quickly lose their attention and ‘buy-in’.
Defining how we measured engagement came first and foremost. At times we had around 20% of students flagged at ‘red’ but never let these flags exclusively dictate our actions. Finding more disengaged students than expected focussed our attention on determining the support processes we could offer.
Next steps
Now we are confident that we understand our engagement data, we’re looking at how to truly measure the impact of learning analytics, and how to apply the lessons we’ve learned to curriculum and curricular analytics.
Get involved
Thanks to Mimi and Ethan for sharing their experiences. You can learn more about our project to make learning analytics faster, more efficient and easier to use from our R&D page Enhancing the tools for UK universities to improve student engagement.
Learning analytics will also be a point of focus at the Data Matters 2025 conference for strategic data leads in HE and FE sectors on 23 January 2025 – we’d love to see you there!